Module 11 sẽ hướng dẫn bạn thiết lập Performance Baseline, Xác định nguyên nhân ảnh hưởng đến performance, và xem và cấu Hình Centralized Event Logs
Module 11 gồm các phần:
- Thiết lập Performance Baseline
- Xác định nguyên nhân ảnh hưởng đến performance
- Xem và cấu Hình Centralized Event Logs
Exercise 1: Thiết lập Performance Baseline
Task 1: Tạo và thực hiện data collector set
- Tại Máy PC02 vào Server manager, chọn Tools chọn Performance Monitor.
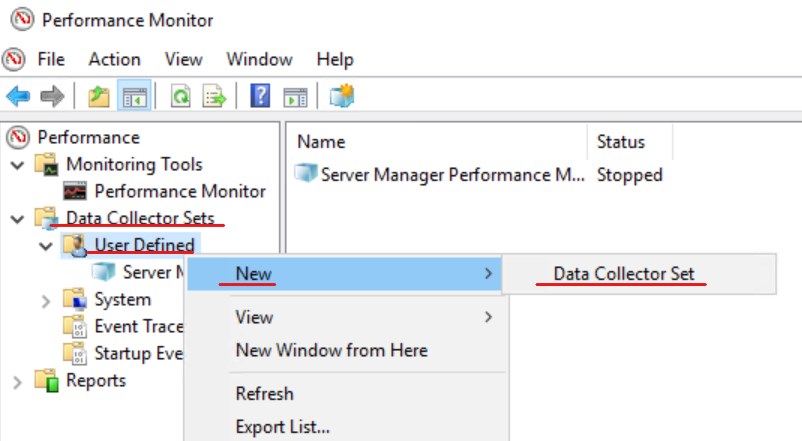
- Màn hình Performance Monitor, menu trái chọn Data Collector Sets, phải chuột vào User Defined chọn New, và chọn Data Collector Set
3. Cửa sổ Create new Data Collector Set, trong phần Name nhập vào PC02 Performance, chọn option Create manually (Advanced), và ấn Next.
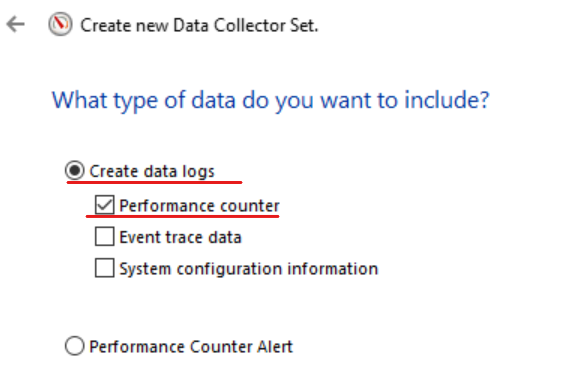
4. Cửa sổ What type of data do you want to include? chọn option Create data logs và chọn checkbox Performance counter ấn Next
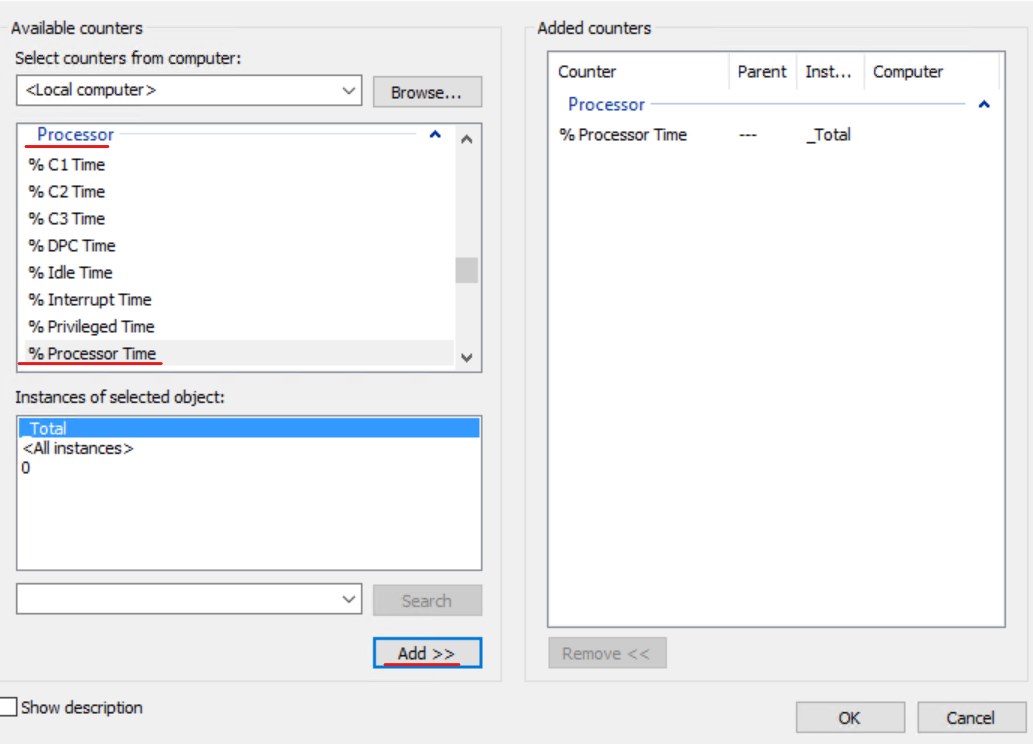
5. Cửa sổ Which performance counters would you like to log? ấn Add.
6. Trong phần Available counters, tìm và chọn Processor, chọn %Processor Time, ấn nút Add >>.
7. Tương tự tìm Memory, chọn Pages/sec, ấn Add >>.
8. Tìm PhysicalDisk, chọn %Disk Time, và Avg. Disk Queue Length, ấn Add >>.
9. Tìm System, chọn Processor Queue Length, ấn Add >>.
10. Tìm Network Interface, chọn Bytes Total/sec, ấn Add >>, và ấn OK.

11. Cửa sổ Which performance counters would you like to log? trong phần Sample interval nhập vào 1, ấn Next
12. Cửa sổ Where would you like the data to be saved? ấn Next.
13. Cửa sổ Create the data collector set?, chọn option Save and close, và ấn Finish.
14. Phải chuột vào PC02 Performance vừa tạo chọn Start.

Task 2: Giả lập xử lý dữ liệu lớn trên PC02
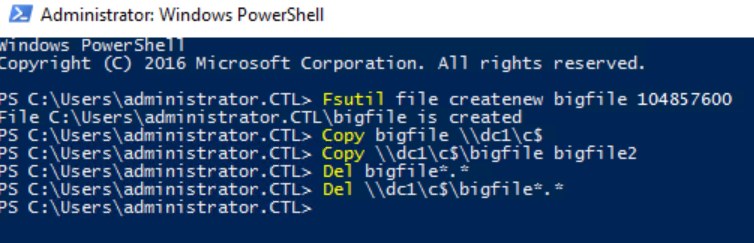
- Tại PC02 vào Start, chọn Windows PowerShell và thực hiện lệnh sau để tạo bigfile
Fsutil file createnew bigfile 104857600
2. Thực hiện lệnh sau để copy bigfile sang DC1
Copy bigfile \\dc1\c$
3. Thực hiện lệnh sau để copy bigfile từ Dc1 về pc02 với tên là bigfile2
Copy \\dc1\c$\bigfile bigfile2
4. Dùng lệnh sau để xóa bigfile và bigfile2 trên pc02
Del bigfile*.*
5. Xóa bigfile trên DC1
Del \\dc1\c$\bigfile*.*
Task 3: Phân Tích dữ liệu thu thập được
- Trở lại Performance Monitor, phải chuột vào PC02 Performance chọn Stop.
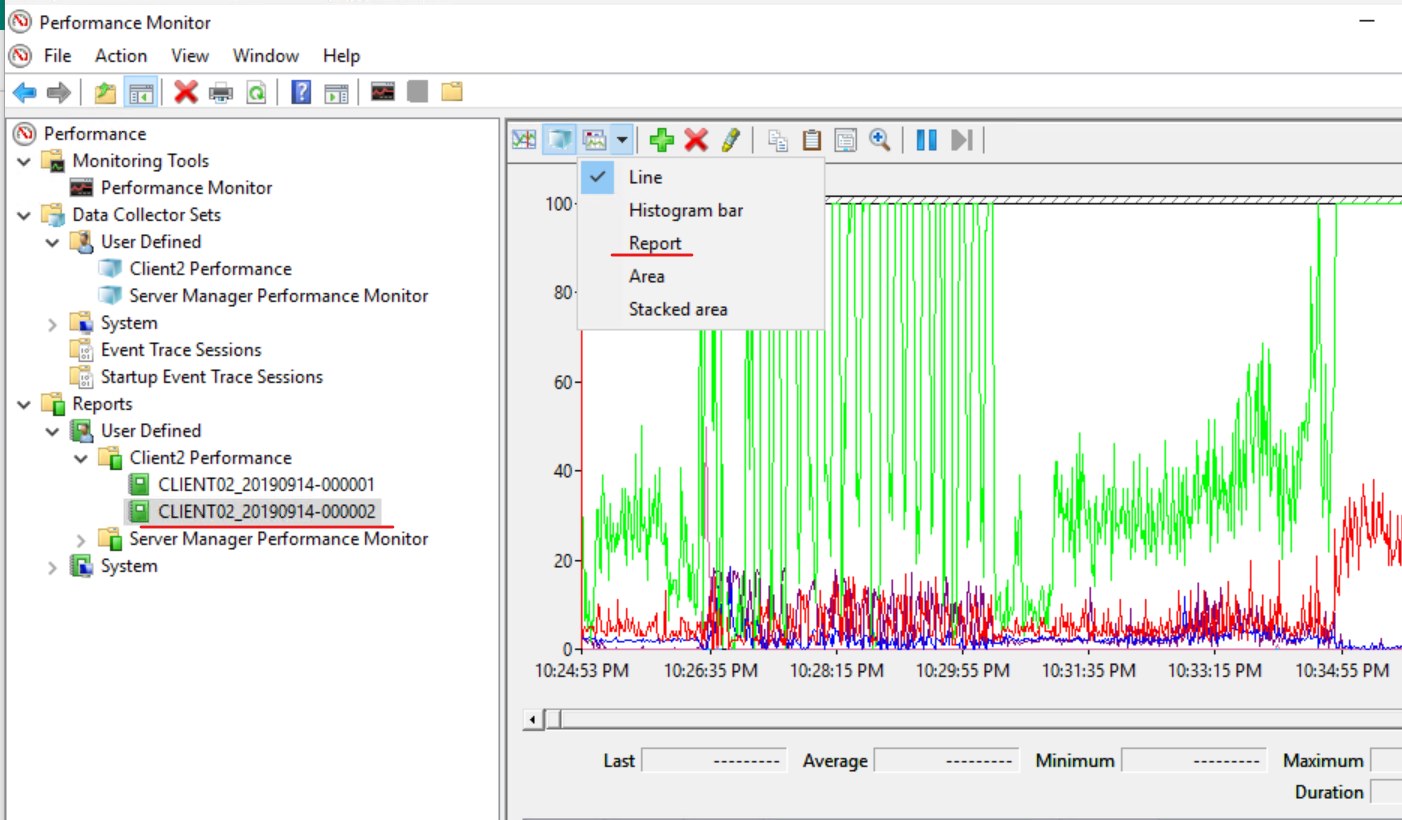
- Tại Performance Monitor, menu trái chọn Reports, chọn User Defined, chọn pc02 Performance, và chọn PC02_DateTime-000001.
- Trên thanh toolbar, chọn icon Change graph type và chọn Report, và xem các thông số.
- Memory, Pages/sec
- Network Interface, Bytes Total/sec
- PhysicalDisk, %Disk Time
- PhysicalDisk, Avg. Disk Queue Length
- Processor, %Processor Time
- System, Processor Queue Length
Ghi nhớ (chụp hình lại) lại các thông số này để so sánh với phần lab tiếp theo

Exercise 2: Xác định nguyên nhân ảnh hưởng đến performance
Task 1: Tạo Thêm Khối Lượng Lớn Trên Client2
- Tại PC02 vào Performance Monitor, chọn Data Collector Sets\User Defined, phải chuột vào PC02 Performance chọn Start
- Tại PC02 vào Windows PowerShell ISE, mở file StressTest.ps1 (file này trong folder AllFiles\Labfiles\Mod12)
- Tại Windows PowerShell ISE, ấn Run Script (F5), chờ thực thi Script xong, đóng Windows PowerShell ISE

Task 2. Kiểm tra lại performance data
- Trở lại Performance Monitor, phải chuột vào PC02 Performance chọn Stop.
- Tại Performance Monitor, menu trái chọn Reports, chọn User Defined, chọn Pc02 Performance, và chọn PC02_DateTime-000002.
- Trên thanh toolbar, chọn icon Change graph type và chọn Report, và xem các thông số.
- Memory, Pages/sec
- Network Interface, Bytes Total/sec
- PhysicalDisk, %Disk Time
- PhysicalDisk, Avg. Disk Queue Length
- Processor, %Processor Time
- System, Processor Queue Length
so sánh với các thông số ở Exercise 1 task 3
Exercise 3: Xem và cấu Hình Centralized Event Logs
Task 1. Chuẩn Bị
- Tại máy PC02, vào run gõ lệnh cmd, enter.
- Cửa sổ command prompt thực hiện lệnh sau:
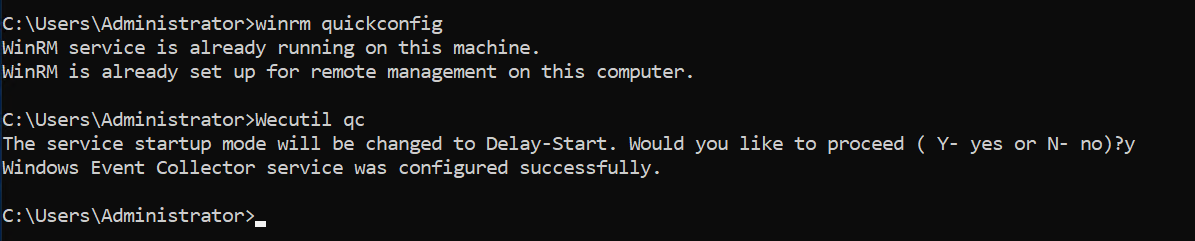
winrm quickconfig
đảm bảo rằng WinRM đang chạy.
3. Cũng tại command prompt gõ lệnh LUSRMGR.MSC, enter
4. Cửa sổ Local Users and Groups, chọn Groups, double click vào Event Log Readers.
5. Cửa sổ Event Log Readers properties, ấn Add
6. Cửa sổ Select Users, Computers, Service Accounts or Groups, ấn Object Types, check chọn Computers, ấn Ok
7. Trở lại cửa sổ Select Users, Computers, Service Accounts or Groups, trong phần Enter the object names to select, nhập vào DC1 ấn check names ấn OK.
8. trở lại cửa sổ Event Log Readers properties, ấn OK
9. Qua máy DC1 vào run gõ lệnh cmd, enter.
10. Cửa sổ command prompt thực hiện lệnh sau và ấn Y
Wecutil qc
Task 2: Tạo Subscription
1. Cũng tại máy Dc1, Cửa sổ command prompt thực hiện lệnh sau:
eventvwr.msc
2. Cửa sổ Event Viewer, phải chuột vào Subscriptions chọn Create Subscription.
3. Cửa sổ Subscription Properties, trong phần Subscription name nhập vào PC02 Events Viewer
4. Chọn option Collector initiated, và ấn Select Computers.
5. Cửa sổ Computers, ấn Add Domain Computers.
6. Cửa sổ Computer, trong phần Enter the object name to select nhập vào PC02 ấn check names, ấn OK, và Ok

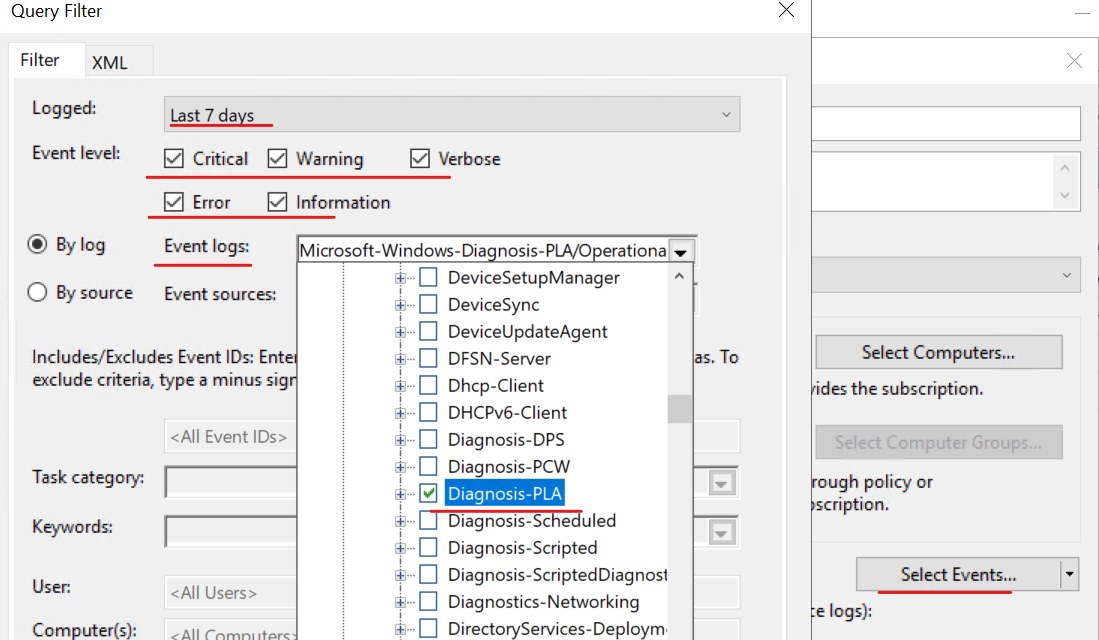
7. Trở lại cửa sổ Subscription Properties, ấn Select Events.
8. Trong phần Logged chọn Last 7 days.
9. Trong phần Query Filter check chọn các check box Critical, Warning, Information, Verbose, và Error.
10. Trong phần Event logs chọn Applications and Services Logs > Microsoft > Windows > chọn Diagnosis-PLA, ấn Ok và OK.
Task 3: Tạo Performance Counter Alert
1. Trở lại máy Pc02, vào Server manager, chọn Tools chọn Performance Monitor.
2. Màn hình Performance Monitor, menu trái chọn Data Collector Sets, phải chuột vào User Defined chọn New, và chọn Data Collector Set
3. Cửa sổ Create new Data Collector Set Wizard, trong phần Name nhập vào PC02 Alert, chọn option Create manually (Advanced), và ấn Next.

4. Cửa sổ What type of data do you want to include? chọn option Performance Counter Alert, và ấn Next.
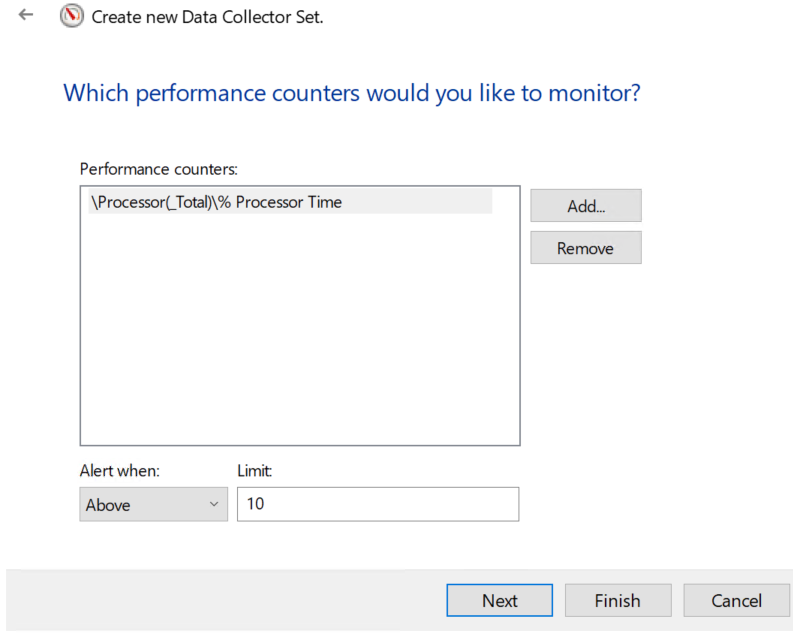
5. Cửa sổ Performance counters would you like to monitor? ấn Add.
6. Cửa sổ danh sách Available counters, bung Processor, và chọn % Processor Time, ấn Add, và OK.
7. Trở về cửa sổ Which performance counters would you like to monitor? trong phần Alert when chọn Above, trong phần Limit nhập vào 10, và ấn Next. và Finish.
8. Chọn PC02 Alert vừa tạo, phải chuột vào DataCollector01,và chọn Properties
9. Cửa sổ DataCollector01 Properties, trong phần Sample interval nhập vào 1 chọn tab Alert Action
10. Check chọn Log an entry in the application event log ấn OK
11. Phải chuột vào PC02 Alert, chọn Start.

Task 4. Giả Lập Quá CPU
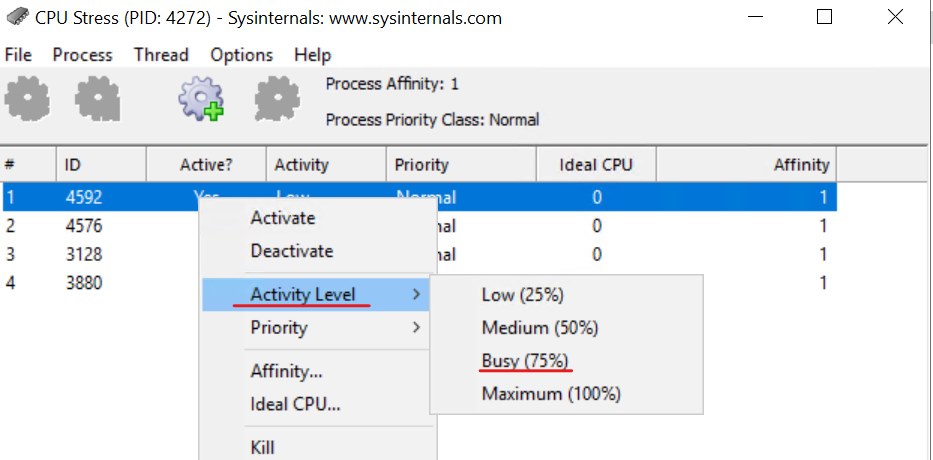
- Tại máy PC02 thực thi file CPUSTRES64.EXE (bạn có thể doanload tại https://docs.microsoft.com/en-us/sysinternals/downloads/cpustres)
- Cửa sổ CPU Stress, phải chuột vào dòng đầu tiên chọn Activity Level, và chọn Busy (75%).
- Chờ vài phút, đóng cửa sổ CPU Stress.
Task 5: Kiểm Tra
- Qua máy Dc1, vào Event Viewer, chọn Windows Logs và chọn Forwarded Events.
- Quan sát xem có Events ID là 2031

Hoàn tất bài lab